Created by: Inbal Rief, Desualizer
Description:
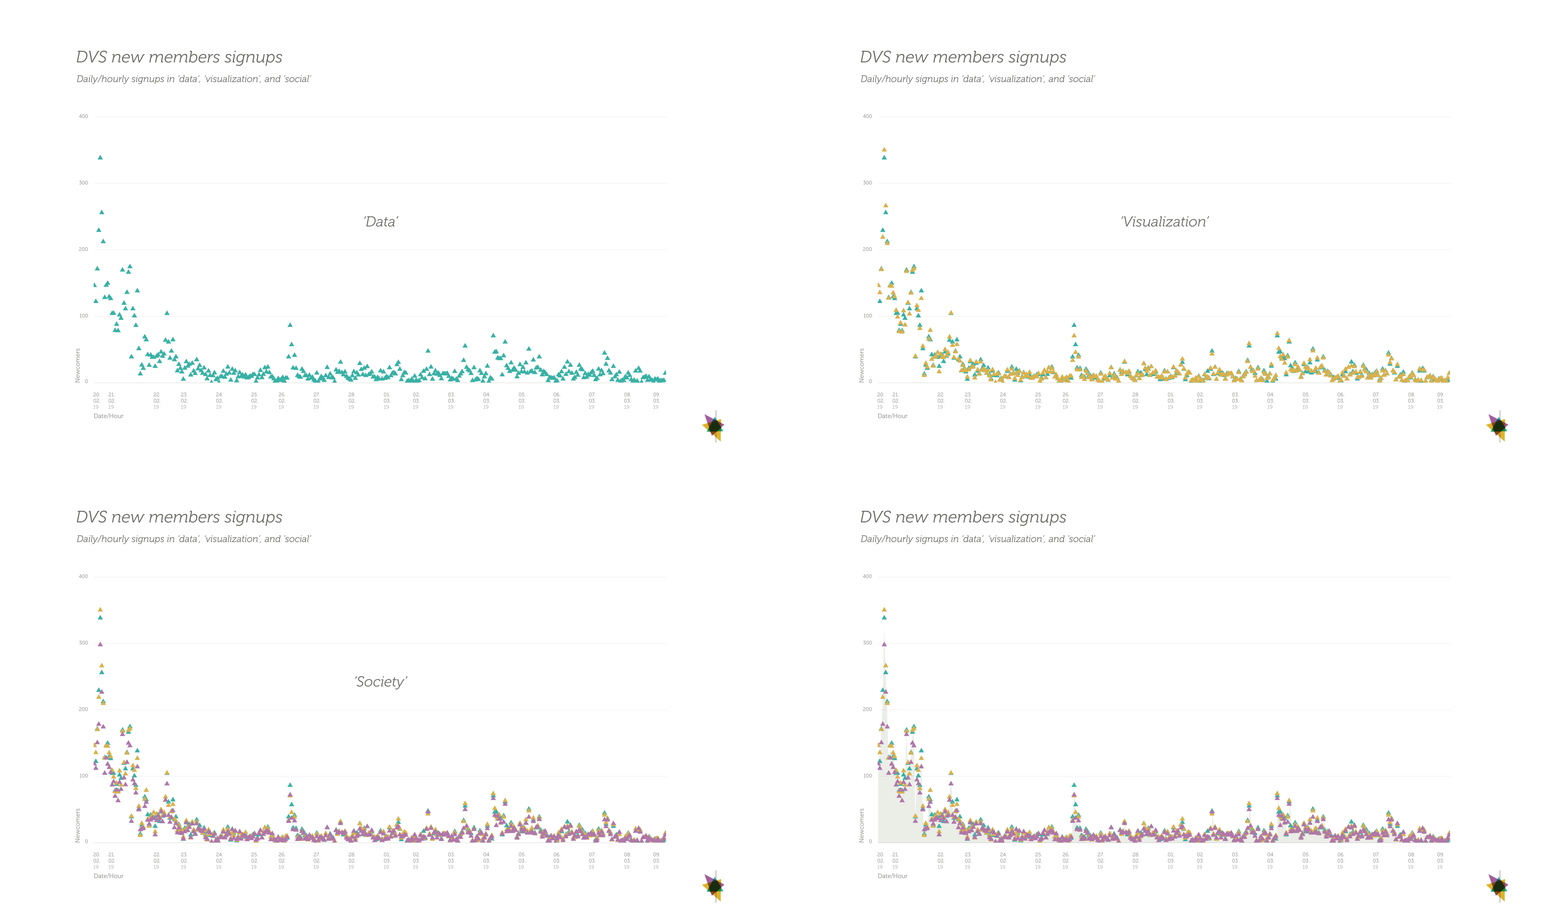
When joining The Data Visualization Society (DVS) we were asked to rank ourselves on 3 topics - data, visualization and society (each had 3 pertaining measures) in order to create our own data visualization fingerprint. The following viz explores our community’s birth rhythm based on new members self-rating, from Feb 20 to Mar 9, 2019.
Process for Creation:
I've started from analysis DVS dataset to sketching and generating lots of charts (Raw graphs, Datawrapper, Google Sheets), and next I've moved to a full-scale design in Illustrator.

