Created by Michelle McGhee
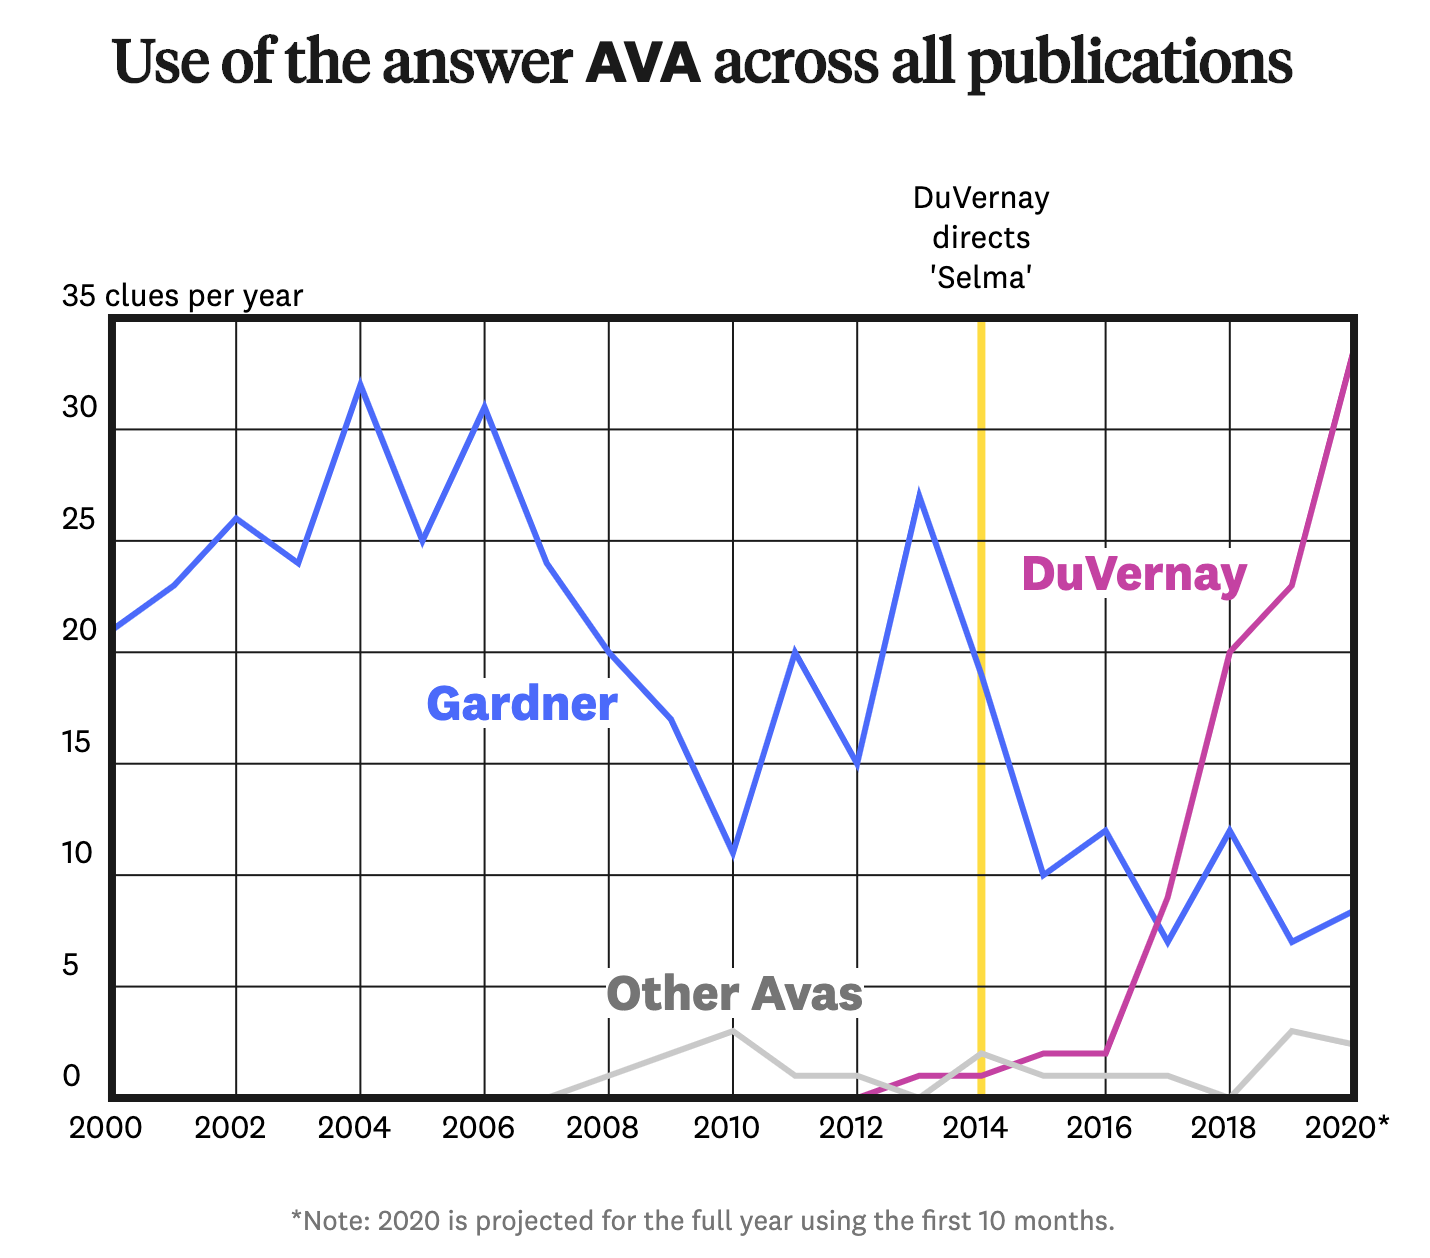
Description of visual: A look at representation and inclusivity in crossword puzzles.
Process for creating work: To generate the waffle charts about race and gender, I (and a small team of other data collectors) sampled thousands of crossword clues across decades and publications, then manually went through to find ones whose clue or answer involves a person. Then, I went through each person, researched them, and labeled their gender and race.
I built the article and all the charts using React and D3.