

CREATED BY: Darren Aitchison
DESCRIPTION:
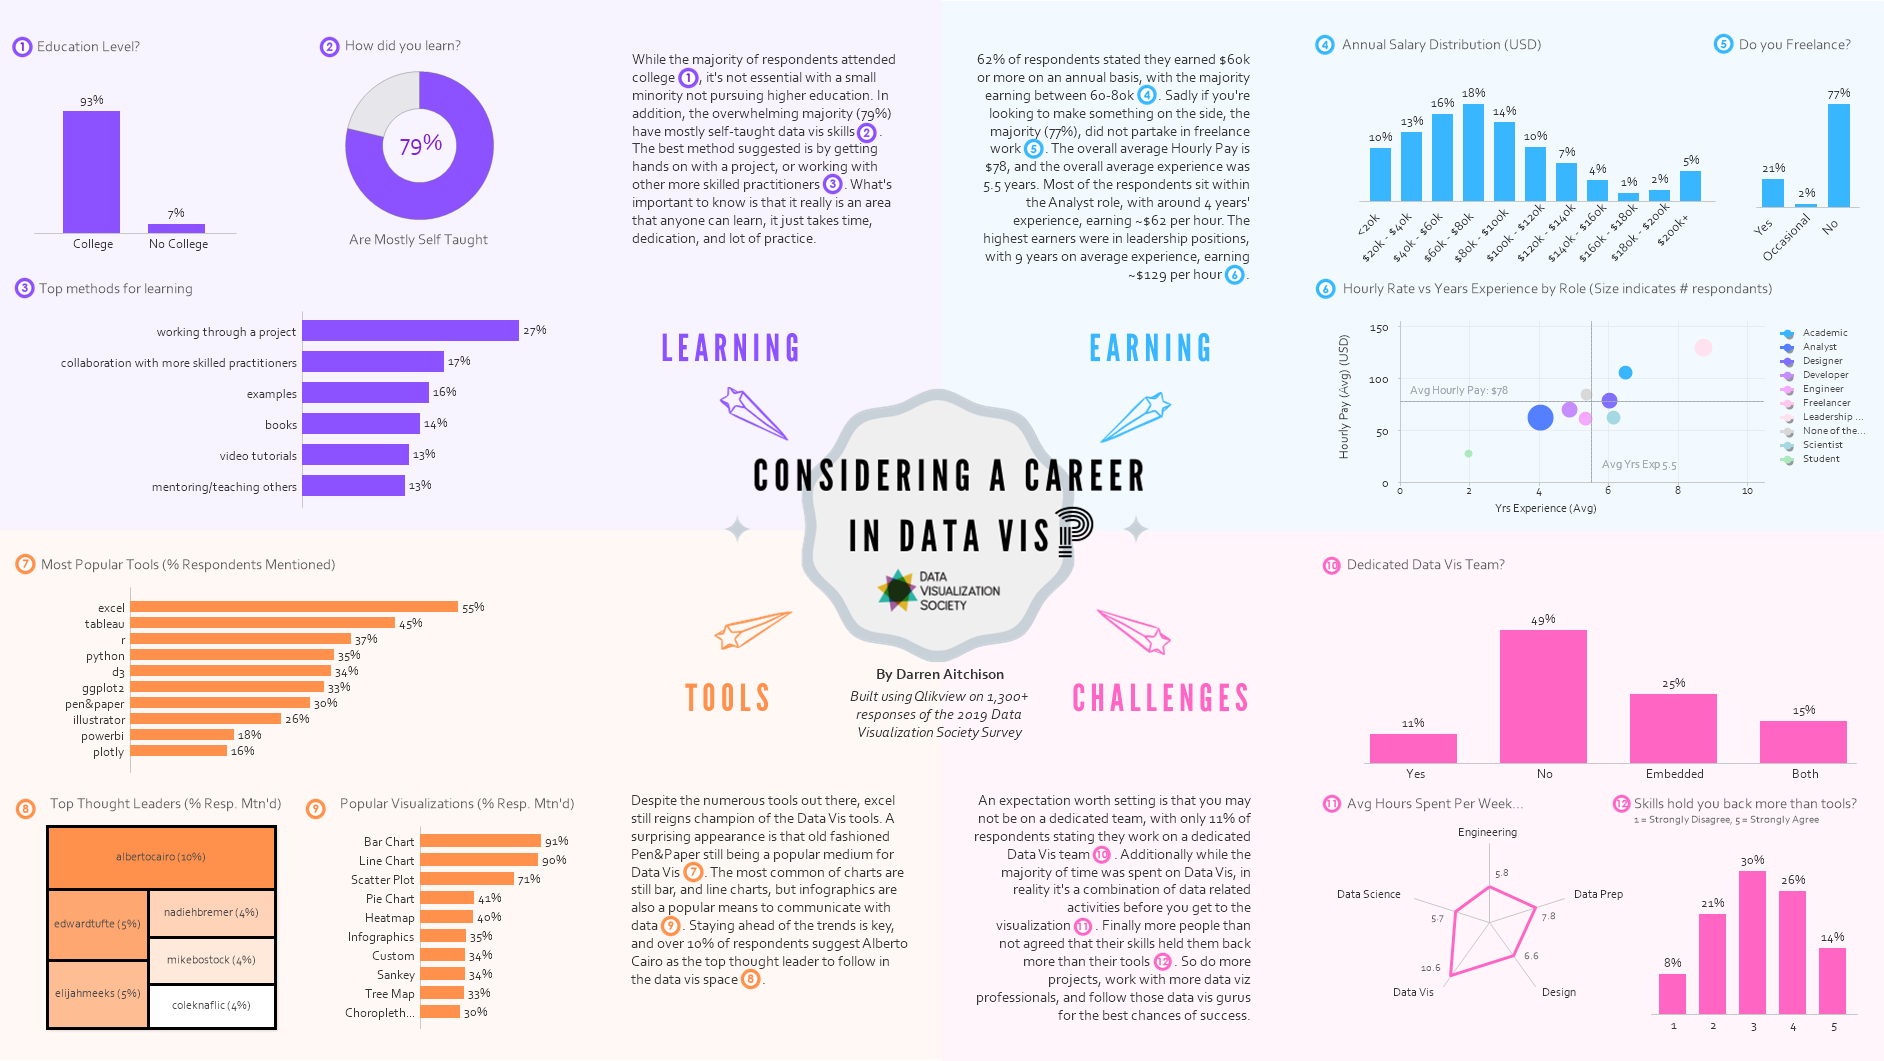
Like most in the profession I stumbled into data visualization, looking through the survey results it reinforced my belief that anyone can learn data visualization, so I wanted to provide a quick "at a glance" reference for anyone who's considering getting into the field. Hopefully, this will convince a few more to explore further or a least give data vis a try.
PROCESS:
I started by loading the data into Qlikview, from there i began to explore the responses performing some data profiling to get a feel for the results.
From there I began a mind map of interesting insights/observations i'd made.
Once I had enough i began to group these into common areas, and that is where my thought to build a visualization that would assist those who are considering entering the field.
After that i'd created a mock up on pen/paper as to how i wanted it to look and feel, created the logo and started building up the elements. There was some additional data transformation required on a few of the answers.
From there it was a case of massaging and adjusting until i had a layout. I thought it would be useful to summarize what i'd taken away and share that with the audience. Sadly the tool (Qlikview) was limited in regards to what i can do in regards to text editing, but i managed to find a way to link back the dialog to the visualization.
Then it was just some fine tuning/adjusting and taking a look each day for a few days until I was satisfied.